Each indicator has at least two parameters: Time Frame and Shift.
Time Frame

Current (default) time frame is the chart on which the EA is attached. You can use indicators calculated on different time frames by changing the Time Frame parameter. To make sure that historical data for a particular time frame is preloaded on your MetaTrader platform, switch to that time frame, wait until the data loads, and switch back to the current time frame.

Shift

Shift is always the last parameter. It represents the number of bars back in history. The indicator with the Shift value of 0 (default) returns the value at the current bar and it changes as the price moves. The indicator with Shift = 1, 2, 3, etc. returns historical values. For example, to get the indicator value at the previous bar (closed candlestick), set Shift to 1.
Important: Shift must be zero or positive!
Example: Buy when MACD crosses above the signal line and MACD is below zero

Condition 1
As with the Stochastic Oscillator from the video tutorial, MACD has two buffers: the Base line and the Signal line.
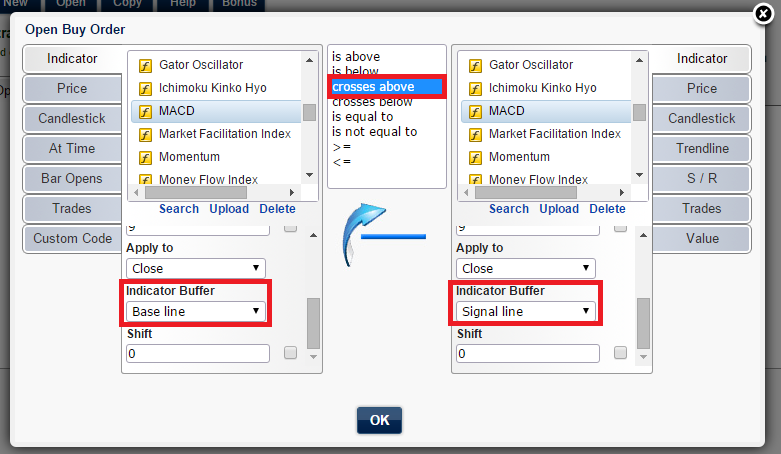
Condition 2


You can easily create the opposite conditions for sell.
Example: Bollinger Bands Buy / Sell

•Buy when price crosses above the lower band
•Sell when price crosses below the upper band

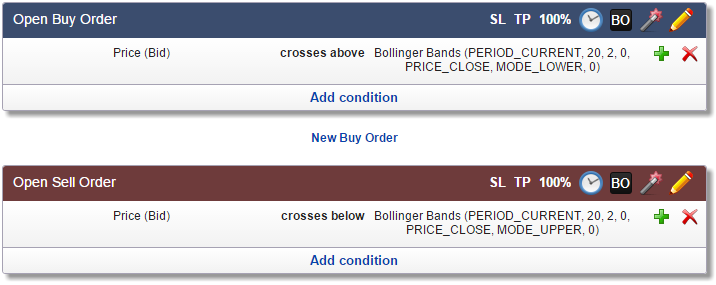
Note: The middle line is a simple Moving Average with the same period as Bollinger Bands.
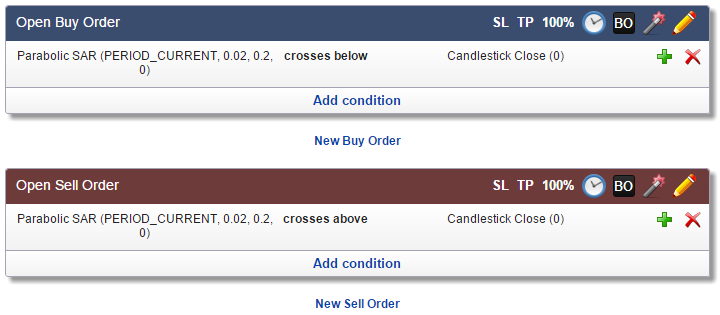
Example: Parabolic SAR Buy / Sell
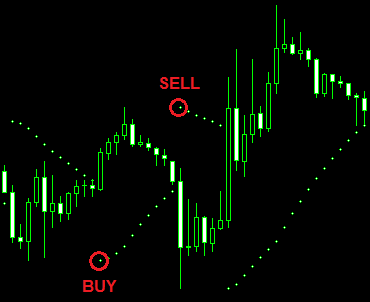
•Buy when a Parabolic SAR dot appears below the current candlestick and there is a dot above the previous candlestick
•Sell when a Parabolic SAR dot appears above the current candlestick and there is a dot below the previous candlestick

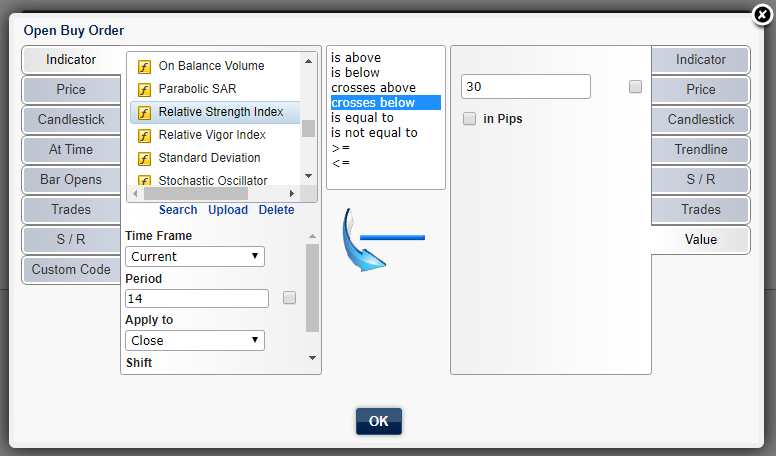
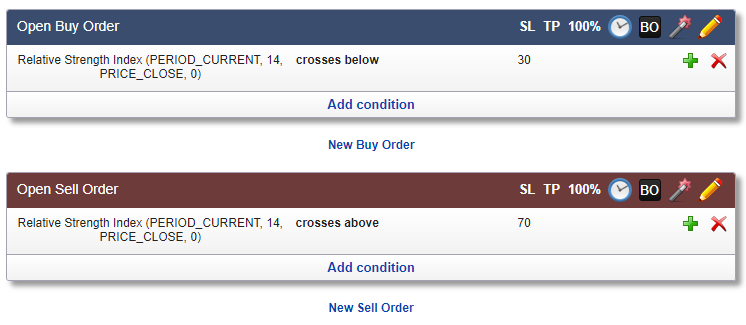
Example: Buy / Sell when Relative Strength Index (RSI) crosses the levels 30 / 70

Example: Moving Average crossover strategy with no inside-bar crossovers
The moving average crossover example from the video tutorial is triggering trades on each crossover that may also occur inside the bar. As a result, historical trades may visually appear in places where the moving averages apparently didn't cross. This is not an issue as moving averages are typically plotted on closing prices and therefore we don't see crossovers that actually happened inside the bar (they appear as temporary crossovers in a slow visual backtest). The following setup is a different way to deal with the moving average crossovers. It will send an order only if the crossover is confirmed at the candlestick's close.
Buy when all three conditions match:
•Send order when a new bar opens
•The fast moving average is above the slow moving average on the previous bar (Shift = 1)
•The fast moving average is below the slow moving average two bars ago (Shift = 2)
Note: The Shift parameter for the second condition must be set to 1 in order to refer to the previous bar that has just closed.

Example: RSI crosses its Moving Average
The following condition is wrong, because RSI ranges from 0 to 100 while the Moving Average is applied on the price chart which has a different range.

What we want instead is Moving Average applied on RSI. In MetaTrader, this can be accomplished by dragging the Moving Average indicator from the Navigator window over the RSI chart and then choosing Apply to: First Indicator's Data.

In EA Builder, it's similar − change the Apply To parameter to Other Indicator's Data. A new parameter will appear below: Indicator Data.
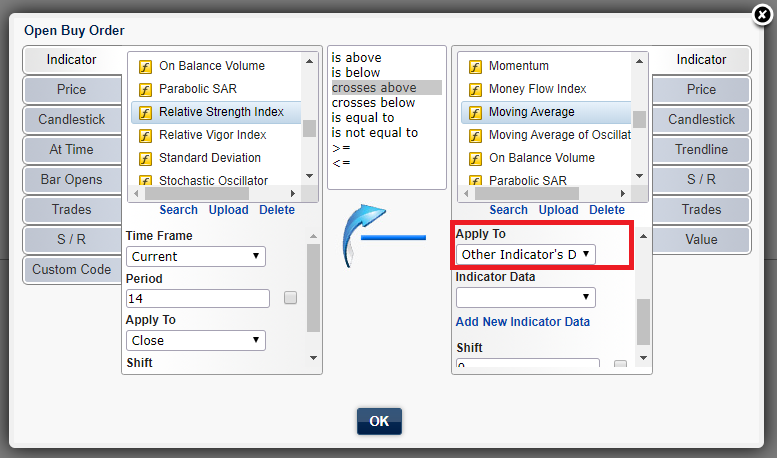
At first, there's no Indicator Data to select (the list is empty), therefore click on Add New Indicator Data. A new window will appear.

Choose the Relative Strength Index and click OK. Now the Indicator Data parameter is filled with Indicator Data 1 (Relative Strength Index).

Click OK and you see that two conditions were added.
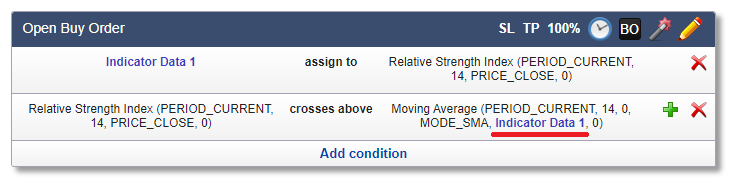
The first line means that the RSI indicator is assigned to a reference named Indicator Data 1. This reference is used as a parameter for the Moving Average. In other words, Moving Average is applied on Indicator Data 1 which is RSI.
Now click on the magic wand to create the opposite conditions for sell.

It has created the opposite condition, but didn't copy the Indicator Data 1 assignment, because it's already assigned. The reference Indicator Data 1 needs to be assigned only once and can be reused in any other order in any tab.
The visual backtest may show many "invisible" (inside-bar) crossovers that will trigger a buy or sell order. To avoid these inside-bar crossovers, we can do it in the same way as the above example with moving averages.

 Note that all these examples still need a fix to prevent opening multiple trades within a few ticks: check Maximum Open Trades.