In this tutorial, I'm going to show you a quick and easy way to create indicators with EA Builder. Let's create a simple indicator based on the Stochastic Oscillator. This example can act as a starting point for creating your own indicators.
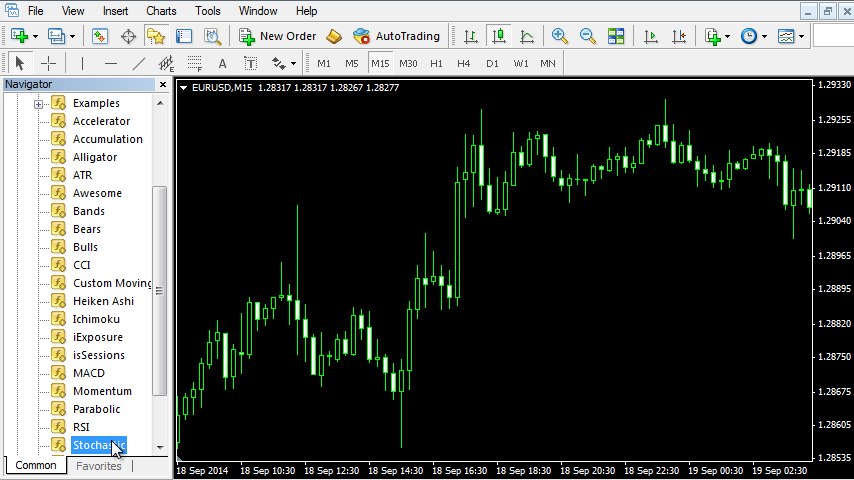
Let's attach the Stochastic Oscillator to the chart.
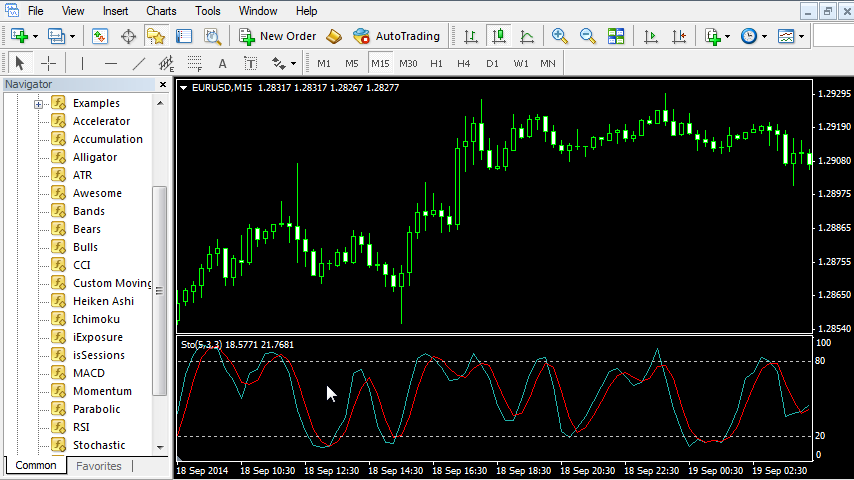
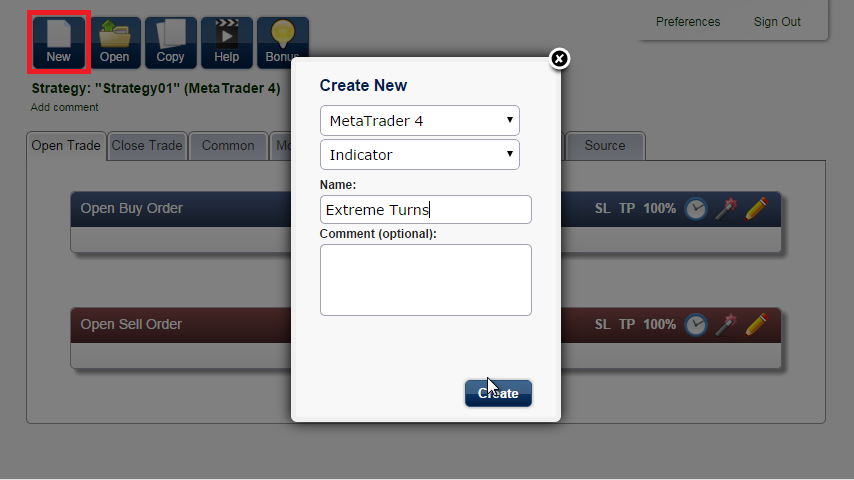
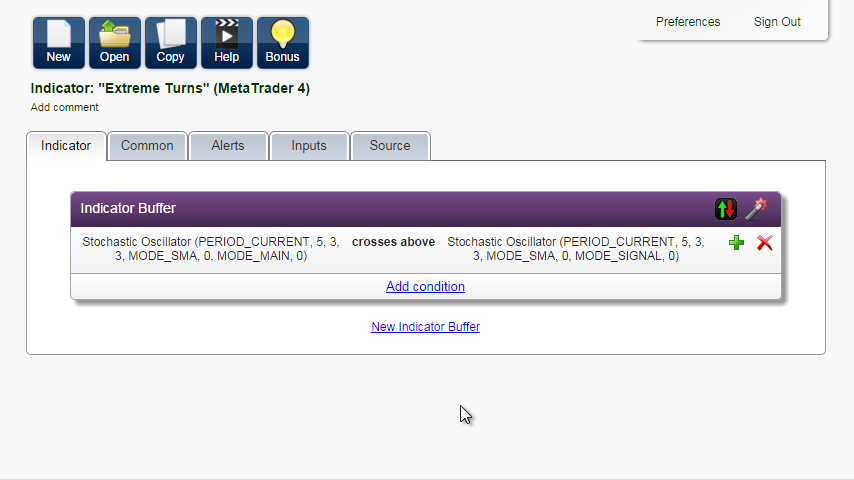
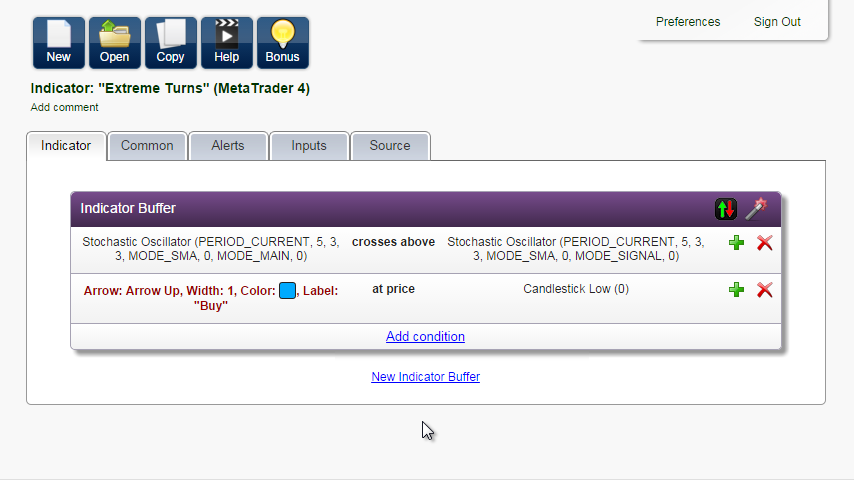
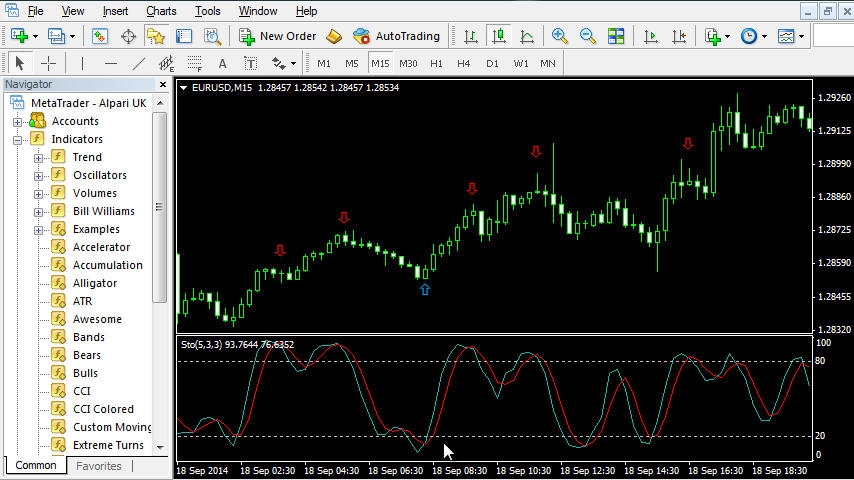
You can see a blue line and a red line oscillating between the market extremes. The blue line is the so-called base line and the red line is the signal line. When the base line crosses the signal line, we want to display an arrow to buy or sell. So let's do it. Create a new MetaTrader 4 indicator and call it Extreme Turns.
Add condition...
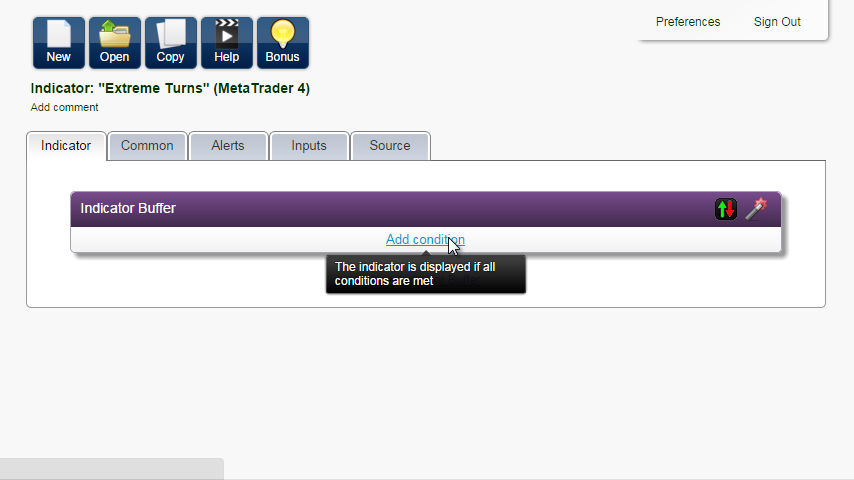
Stochastic Oscillator, the Indicator Buffer is Base line, crosses above, and again Stochastic Oscillator, but here we choose the Signal line.
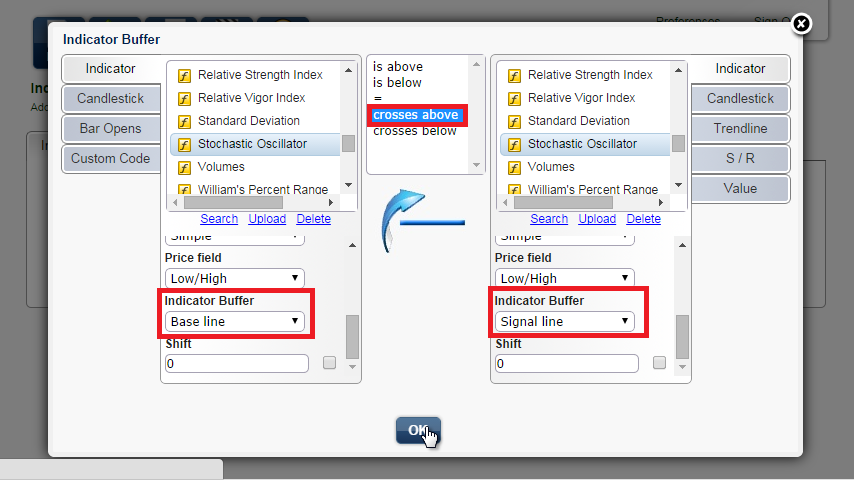
Click OK.
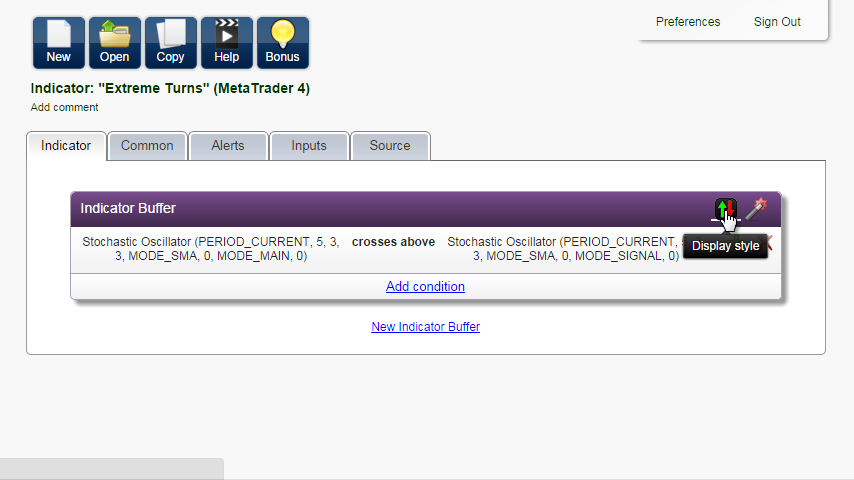
Now click on this icon to customize Display style:
The indicator type is Arrow, Arrow Up, the color is blue, the Label is "Buy" and the arrow will be drawn at the Candlestick Low.
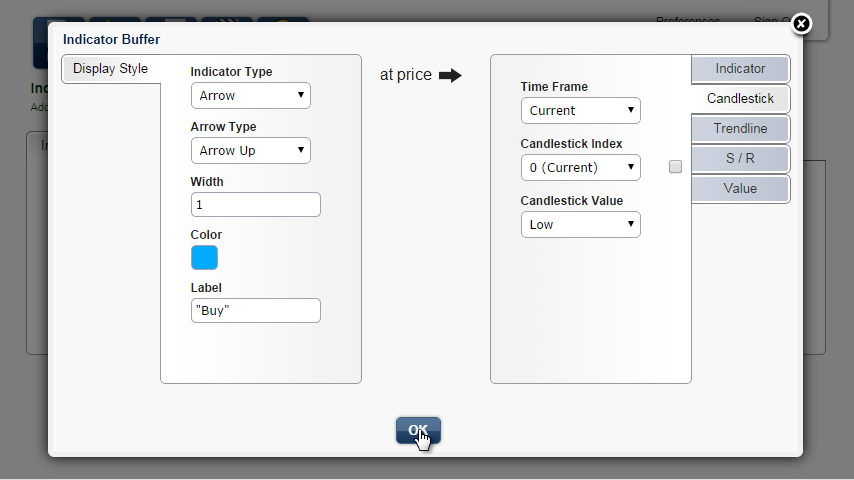
We leave it as it is. Click OK.
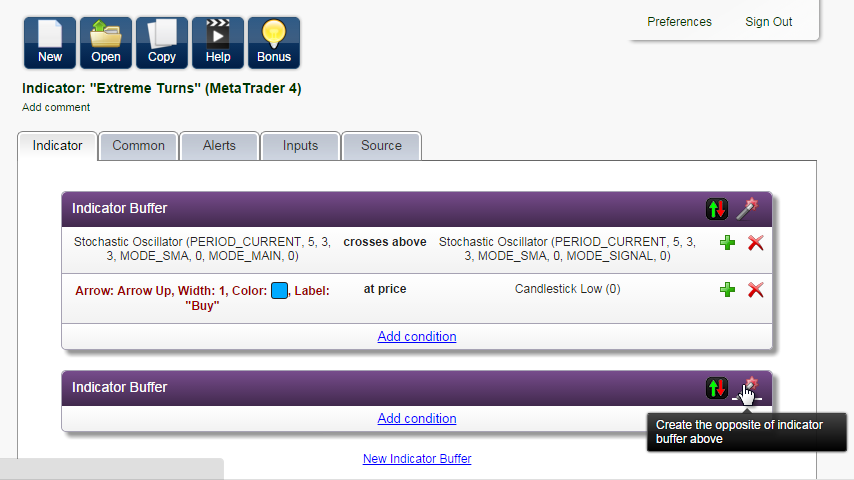
Now let's create the red arrow for Sell. Click on New Indicator Buffer, and here is one smart button that will do the job for you: Create the opposite.
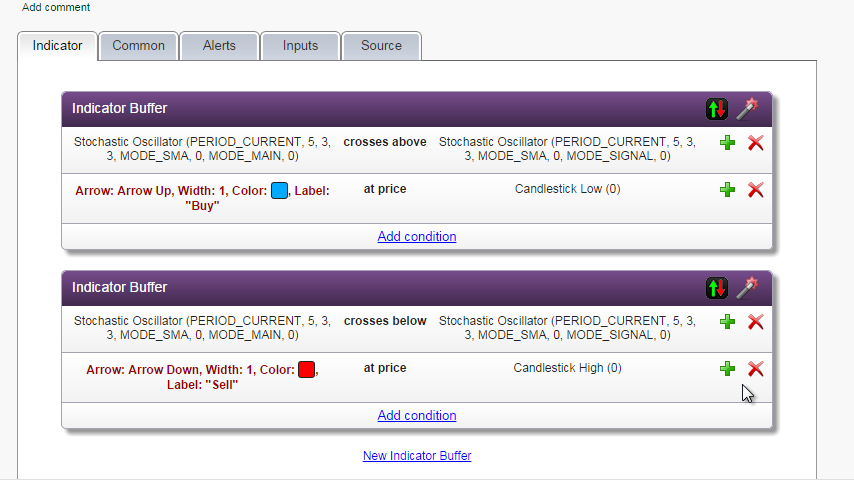
The condition changed to crosses below, the arrow is down, in red, and it will be drawn at candlestick high instead of low. We are happy with what we see, so we can move on. In the Common tab, we can choose whether to draw the indicator in the price chart or as a separate window. We leave it in the chart window.
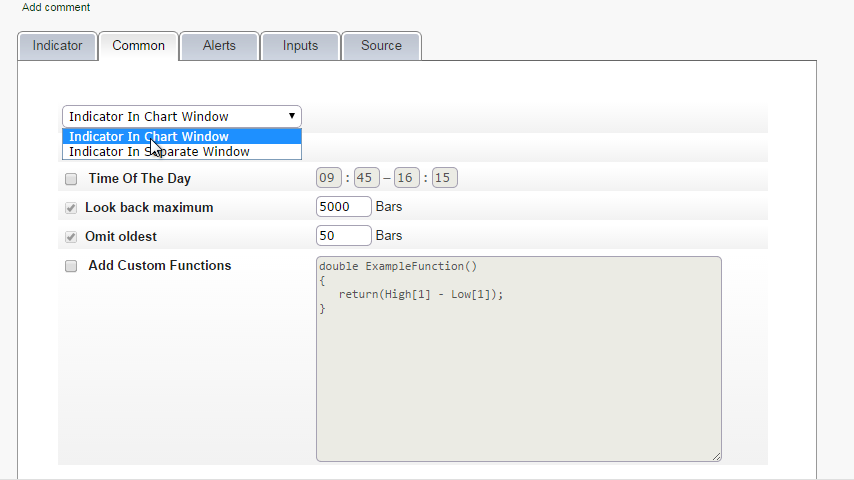
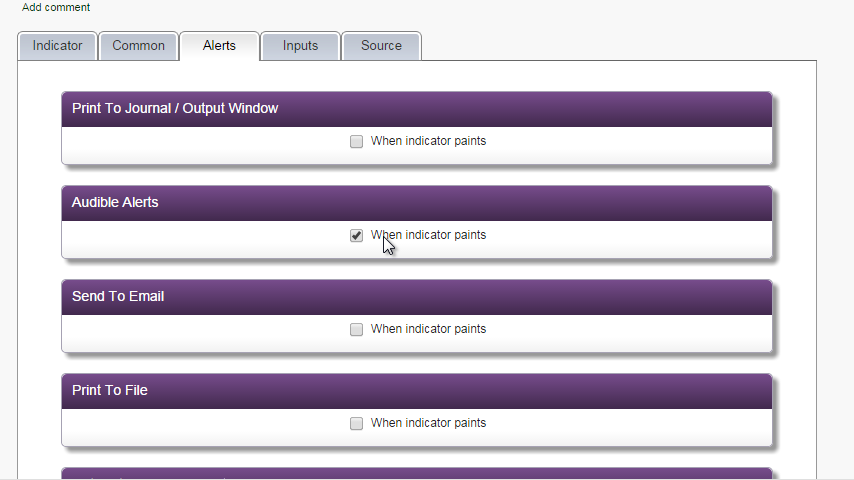
In the Alerts tab, we check Audible alerts, so that we hear a sound and see a popup message every time a new arrow appears.
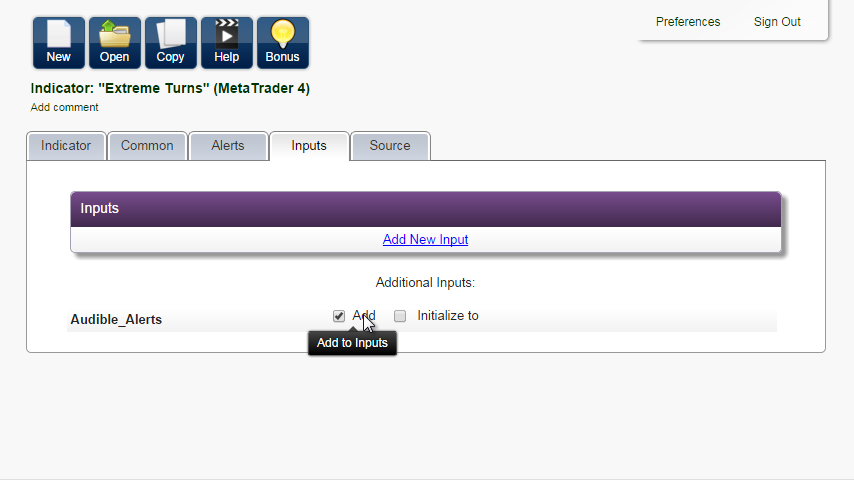
In Inputs, we add Audible Alerts, so that we can turn it on and off.
In the Source tab, the source is generated very quickly. The code is human readable and well commented. It does not include any extra files or advanced object programming, so it can be a useful study aid, but you don't need to understand it.

Now you can either download the file and install it on your platform, or copy the source. Do whatever is more convenient for you.
I will copy the source and compile it (jump to another topic for explanation).
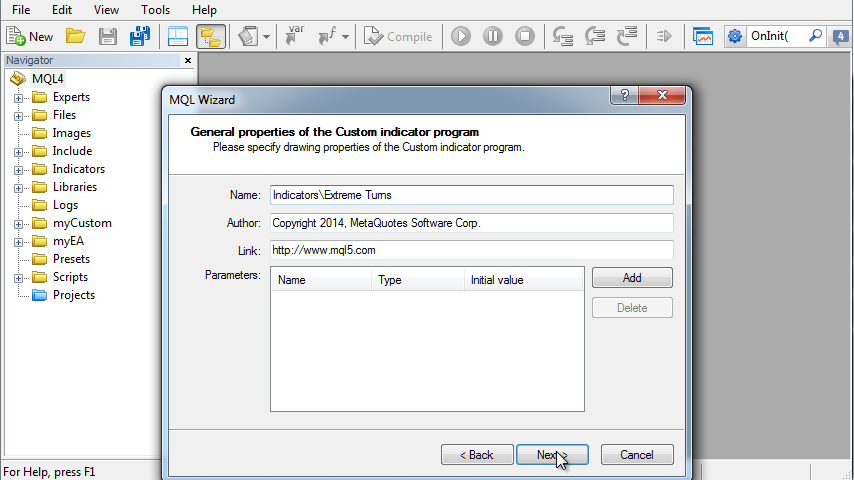
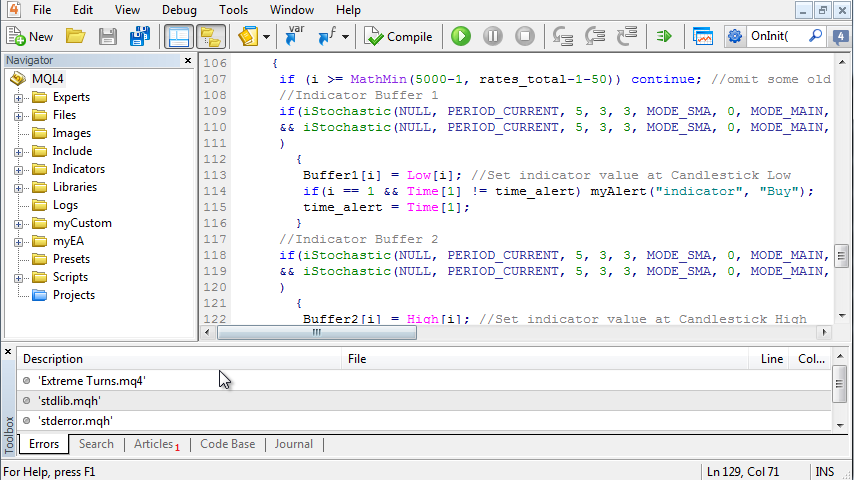
Go back to MetaTrader, and our new indicator appears in the Navigator on the left.
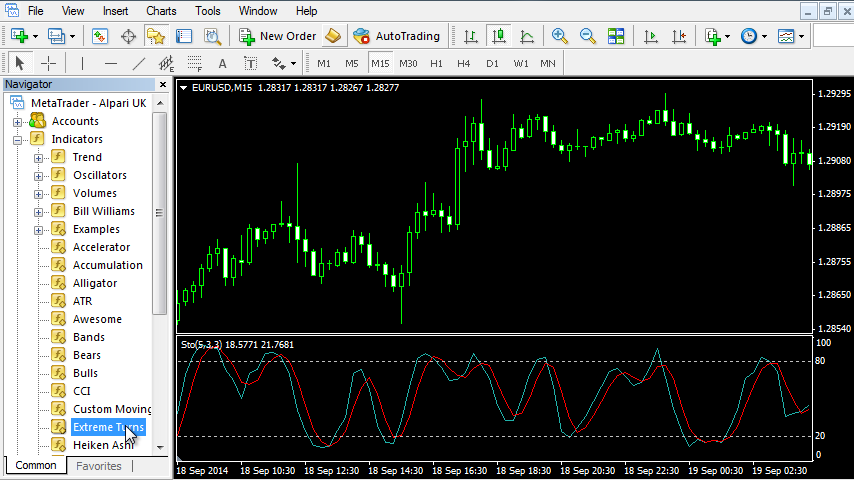
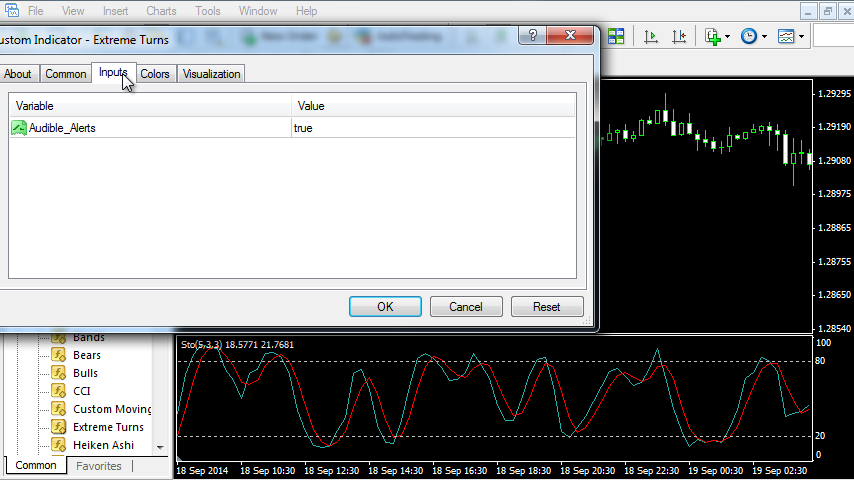
Double-click. We see it has one input Audible_Alerts set to true. Click OK.
We can check that the arrows are drawn correctly as the oscillator lines cross.
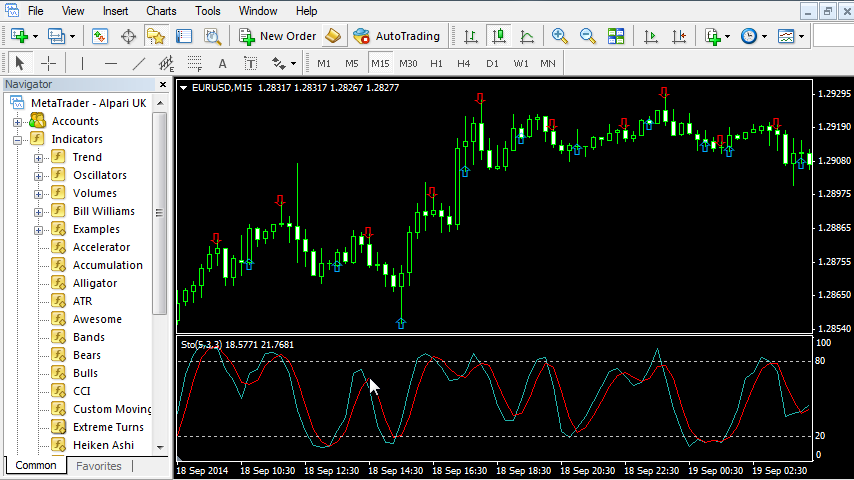
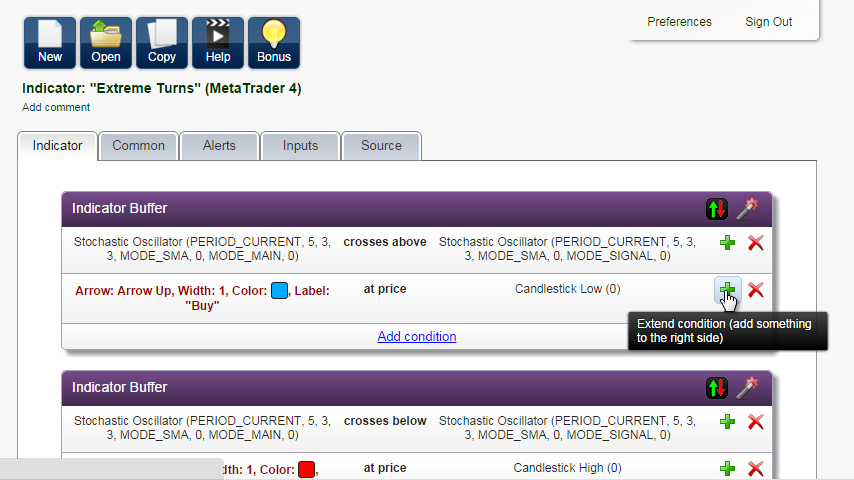
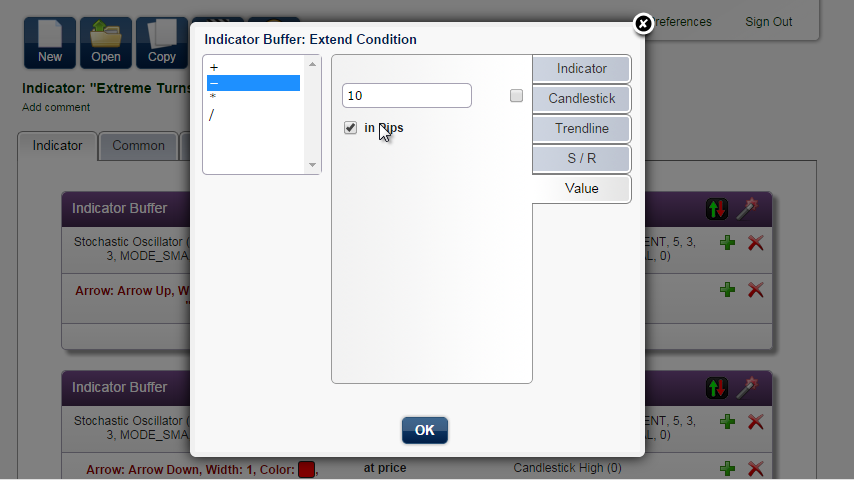
The problem is that the arrows overlap the price a little, and we would like to correct this. Go back to EA Builder and click on the plus sign to extend condition and lower the value of the Candlestick Low to move the arrow lower.
Maybe 10 pips lower.
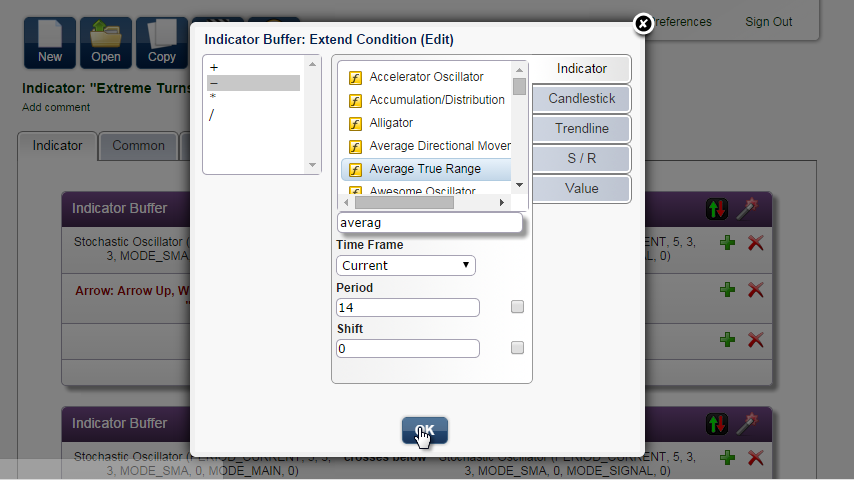
But to make it universal for all currency pairs and time frames, we will subtract the indicator Average True Range.
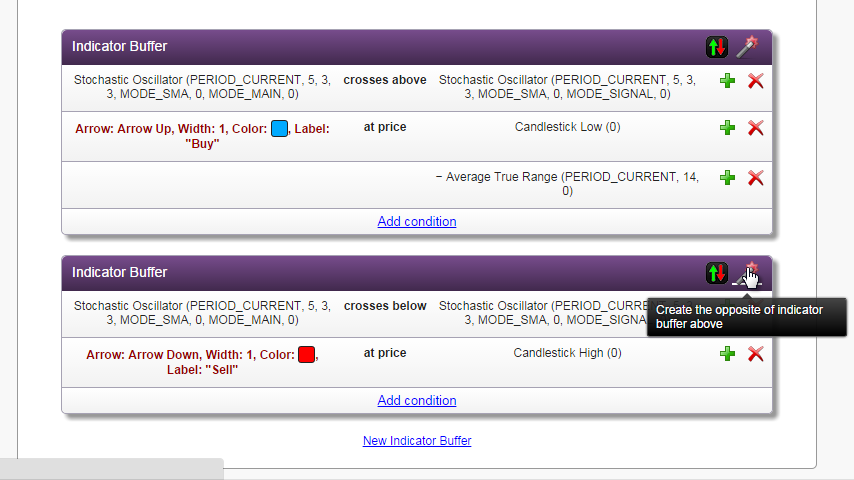
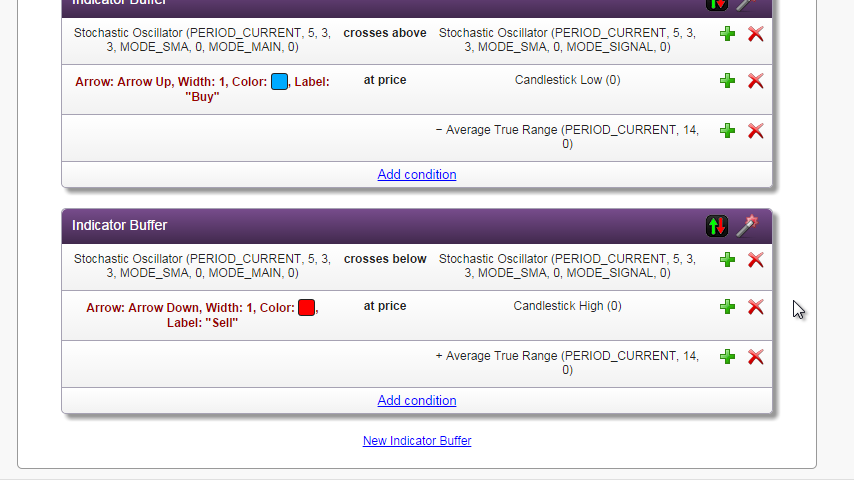
Click on the magic icon and the rest is done quickly. The red arrow is drawn at candlestick high plus the Average True Range.
Copy the source, replace the old source and compile it. Now it looks better.

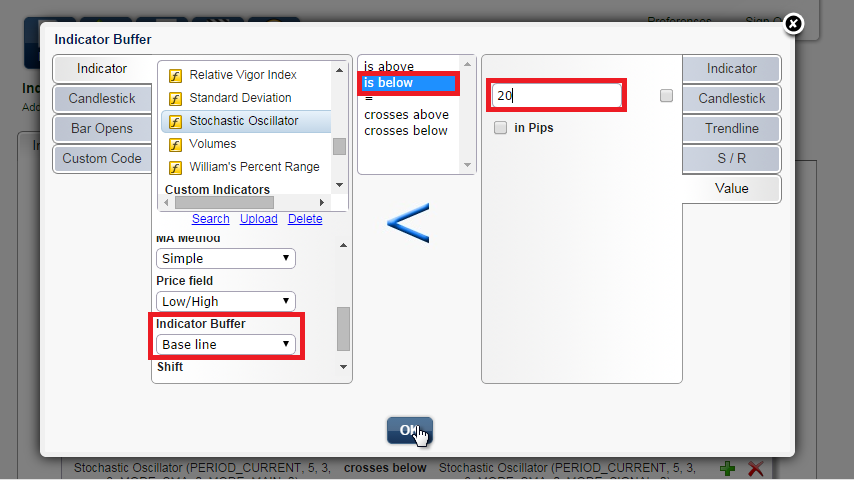
But there are too many arrows when the market is in this flat area. We will make additional conditions to display arrows only at the extremes – beyond the overbought and oversold levels represented by the horizontal lines at values 20 and 80. Go back to the Indicator tab. Add condition: Stochastic Oscillator, Base Line, is below, Value 20.
Create the opposite using the magic button. Edit the automatically created condition and replace 20 with 80.

Copy the source, replace the old source and compile it. Now the arrows only appear in the overbought and oversold zones.
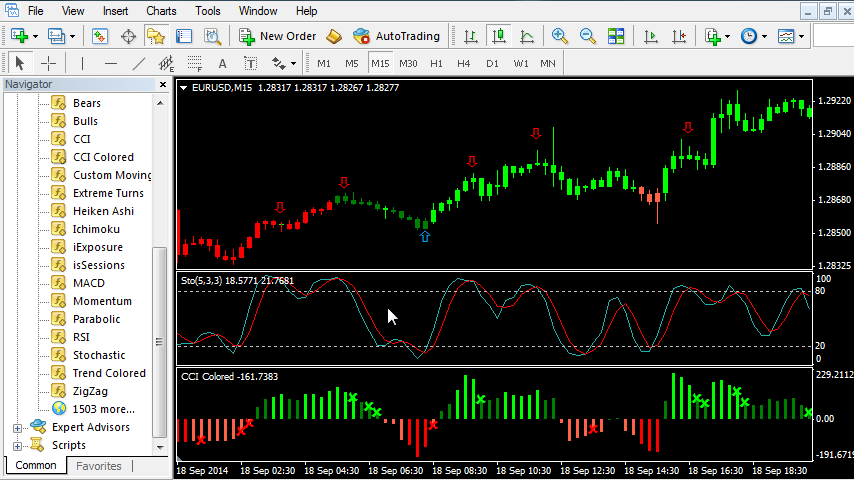
There is still room for improvement. In a trending market, you may want to beware of trading against a long term trend. You can use the trend indicator from our free bonuses to clearly see the trend. And for exiting, you can use your own rule based on the number of pips, or the Colored CCI indicator.
In the next videos in this tutorial I will show you step by step how to create a profitable expert advisor based on daily breakouts and other useful expert advisors. I will start with a simple strategy based on moving averages.